Cheap describes a price; undervalued describes a verdict. A stock is cheap when its multiple sits below peers or its own history. It is undervalued only when the business's quality, consistency, and trajectory show the discount is a mistake. Most cheap stocks deserve their price, and the difference is where value investors make or lose money.
All multiples are trailing twelve months, from our July 2026 issues, data snapshot July 12, 2026. Value Edge scores come from the same issues.
Every low-P/E screen returns bargains and traps in the same list, wearing the same multiples. A portfolio built on cheapness alone collects the traps systematically, because the market marks most merchandise down for a reason. Our July 2026 coverage makes the distinction concrete. Two Japanese companies share one duopoly and an identical Value Edge score of 74, one at 15.96 times earnings, the other at 33.53. Qualcomm trades at 20.27 times while MediaTek, the other half of its own duopoly, trades at 62.43 for the same end market. Inside each pair the moat is shared and the multiples are not. Which of those numbers is an opportunity is precisely the question a multiple cannot answer.
What does a low P/E actually tell you?
One thing. The P/E ratio reports what the market charges for a unit of current earnings, and that is the whole message. It says nothing about whether those earnings persist, whether the balance sheet survives a bad year, or whether the business is quietly losing its position. Treating the answer to one question as the answer to four is the entire anatomy of a value trap. Screens commit it constantly, because price is the only question they can ask cheaply. Hold the Japanese pair in mind. If the multiple were a verdict, the company at 15.96 times would be twice the opportunity of the one at 33.53. Our scores call them the same opportunity, reached by opposite roads, and the rest of this post is about why.
The four boxes every stock falls into
Every stock sorts into one of four boxes, by what its multiple looks like and by where the price sits against fair value. The scores below are Value Edge, the 0 to 100 rating we give every company we cover. It blends four components, Valuation, Consistency, Quality, and Momentum, each measured against industry peers. A score of 65 or above rates Undervalued, 40 to 64 Fair Value, below 40 Overvalued.
| Priced below fair value | Priced fairly or above | |
|---|---|---|
| Looks cheap | Undervalued. Qualcomm, 20.27× | Value trap. Wacker Chemie |
| Doesn't look cheap | Undervalued, invisible to screens. Hoya, 33.53× | Fairly priced, or worse. Teradyne, 66.22× |
Here is each box with a real name from our July 2026 issues.
Top left, Qualcomm. Looks cheap at 20.27 times earnings. The market's case for the discount is real. Apple is insourcing the modems it once bought from Qualcomm, the strongest recent example of a large customer replacing its supplier from the inside, and regulators keep circling the licensing royalties that pay for the chip roadmap. We score it 71, Undervalued, because the price already concedes the growth argument. Momentum is 36, so nothing here is priced for acceleration. And MediaTek, the other half of the same duopoly, sells into the same end market at roughly three times the multiple, with lower gross margins, 46.1% against 54.8%, and no licensing revenue at all. Classification explains that gap better than fundamentals do, and the expectation is that the market eventually closes it.
Top right, Wacker Chemie. The value trap, already sprung, and a post-mortem rather than a call we made in advance. Its 35% share of semiconductor-grade polysilicon looked like dominance and screened like a bargain. But the 12.7% gross margin showed a business with no pricing power in an oversupplied market. The market kept the discount on, and trailing earnings have now gone negative. The discount was a diagnosis. It scores 38, Overvalued.
Bottom left, Hoya. Never looks cheap, which is exactly what hides it. At 33.53 times earnings no cheapness screen will ever return it. Yet the sector median is 45 times, which puts Hoya roughly 25% below its own industry. Its 79% gross margin is the highest in that coverage universe. It scores 74, Undervalued.
Bottom right, Teradyne. Does not look cheap because it is not. The business is excellent, and that is exactly the problem, because the market has already paid for the moat in advance. At 66.22 times the stock is neither a bargain nor a short. It scores 54, Fair Value.
The same four names, side by side:
| Company | P/E (TTM) | Sector median P/E (issue) | Gross margin | Value Edge | Rating |
|---|---|---|---|---|---|
| Qualcomm | 20.27× | 62× (Compute & Memory) | 54.8% | 71 | Undervalued |
| Wacker Chemie | n/m (loss-making) | 45× (Equipment & Materials) | 12.7% | 38 | Overvalued |
| Hoya | 33.53× | 45× (Equipment & Materials) | 79.0% | 74 | Undervalued |
| Teradyne | 66.22× | 45× (Equipment & Materials) | 58.8% | 54 | Fair Value |
A cheapness screen returns the top row, bargains and traps in the same list, and it cannot read the columns at all. Telling one column from the other is the entire job, and it is the part no screen does for you.
Is an expensive stock automatically overvalued?
No, and the mirror-image mistake costs money too. Teradyne is not a short candidate. Its premium is the market pre-paying for a test-equipment franchise it understands correctly, since each new AI accelerator generation needs more test time per chip. The error is subtler than overvaluation. Paying 66 times means paying today for years of delivery that must arrive without disappointment. The return depends entirely on the moat outrunning the price. And the Consistency score of 44 flags how violently test demand has cycled before. Nothing needs to go wrong for the outcome to be mediocre. Symmetry is the discipline here. A high multiple is no more a verdict of overvaluation than a low one is a verdict of opportunity. Both mistakes promote a price observation into a judgment it cannot support.
Two roads to the same 74
AGC and Hoya, the Japanese pair from the opening, hold the EUV mask-blank duopoly between them, roughly 85% of that market, and our system hands both the same 74. The component paths could not be less alike. AGC arrives through price. Valuation 89, Consistency 97, a 15.96 multiple with a 3.27% dividend yield. Its Quality score of 34 is the honest part of the profile. The mask-blank franchise sits inside a conglomerate earning most of its revenue in commodity glass and chemicals, and the score refuses to pretend otherwise. Hoya arrives through quality. Consistency 89 and Quality 89 on the strength of that 79% gross margin, held back by a Valuation component of 53, because 33.53 times is only cheap relative to what the business deserves, never relative to a screen.
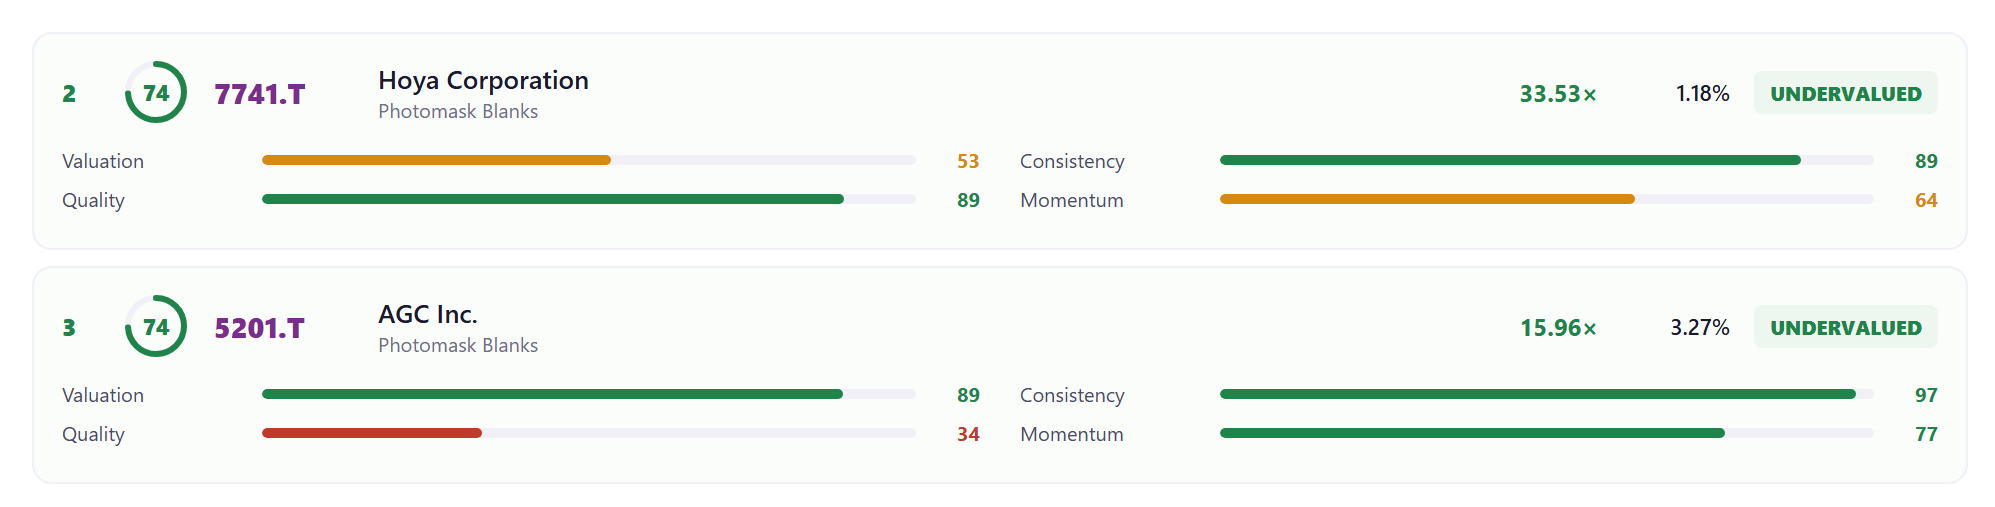
Ranked on P/E alone, AGC looks twice as attractive. Ranked on quality alone, Hoya is far ahead. The composite refuses both shortcuts, which is the practical answer to why Value Edge blends four components instead of sorting on any single ratio. A ranking built on one ratio inherits that ratio's blind spots.
When is a discount justified?
Value traps are not random. They cluster around four detectable conditions, and each maps to a component in our scoring for exactly that reason.
- Margins without pricing power. Wacker's 35% share of semiconductor-grade polysilicon never translated into control over price, and share without margin is not a bottleneck controller position, however dominant it looks in a market-share table.
- Histories that cannot be trusted. Nanya Technology just printed 241% revenue growth, and its Consistency score is 4 out of 100, the lowest in that dataset, because Nanya holds 2 to 3% of a DRAM market whose prices the Big Three set. The growth is real, and it is not Nanya's.
- Earnings at a cyclical peak. A low P/E at the top of a cycle is a forecast of collapse rather than a discount. The memory cycle runs this pattern on schedule.
- Structural decline. Revenue and cash flow trending down year after year say the market is early, not wrong.
A cheap stock passing all four checks is rare. That rarity is the point. The verdict is expensive to produce, which is why no screen will produce it for you, and why a low multiple so often gets mistaken for one.
Why do investors confuse cheap stocks with undervalued stocks?
Partly because cheapness is measurable in one second, while judging whether a discount is justified takes real work. The fast measurement wins by default. Partly because the word value got attached to the fast measurement decades ago, and index products institutionalized the shortcut, sorting the market by price ratios and calling the bottom half value. Whatever that captures, it is not the top-left box. It is the entire top row, traps included, which goes some way toward explaining why naive value strategies spent years disappointing the people who ran them.
The practical consequence for a self-directed investor managing a $100K+ portfolio is a reversal of workflow. Cheapness is where the work starts, never where it ends. A screen produces candidates. The verdict comes from the three questions a screen cannot ask. Can the numbers be trusted? Is the business any good? And where is it heading, toward growth or decline? All three are answerable from public filings by anyone willing to spend an hour per name.
What the next two years reveal
The top row's two boxes look identical on day one, the same low multiples for opposite reasons, and they diverge in observable ways afterward. A value trap re-bases. Earnings fall to meet the price, the discount refreshes itself, and the stock is exactly as cheap two years later on smaller numbers. Wacker shows the end state of that road, a discount the market had right all along, which never closed and finally fell through the floor of positive earnings. An undervalued position resolves differently, in one of two ways. Either the multiple closes toward what the fundamentals justify, or the fundamentals keep compounding under a stubborn multiple, in which case dividends, buybacks, and growth pay the holder while the label stays wrong. AGC's 3.27% yield is that second path's down payment.
Both of our calls here are falsifiable, and it is worth saying how. Qualcomm is wrong if the gap closes downward instead, with the licensing business impaired or the Apple revenue never replaced, so that earnings fall to meet the multiple. Hoya is wrong if a third supplier qualifies in EUV mask blanks, or if the 79% gross margin starts eroding, because that margin is the direct evidence of the moat.
The trap punishes waiting. The mispricing pays for it. That asymmetry only exists when the verdict was right, which is why the interrogation happens before the purchase, not after.
Where the verdict comes from in our system
Value Edge turns the distinction into a number. The Valuation component finds the cheap. Consistency, Quality, and Momentum check whether the cheapness is a mistake or a warning, each ranked against industry peers. The composite only reaches 65, our Undervalued threshold, when the discount survives that questioning. A Valuation score of 92 against failing grades on the other three averages out in the low 40s. Fair Value, no matter how loudly the multiple argues. The system is built to refuse exactly the promotion this post is about, a price observation elevated into a conclusion it cannot carry.
Common questions
What is the difference between a cheap stock and an undervalued stock?
Cheap means the price is low relative to earnings, assets, or peers, which is a measurement. Undervalued means the low price is not justified by the business's quality, consistency, or trajectory, which is a verdict. Most cheap stocks are correctly priced for their problems, and the distinction is where value investors make or lose their returns.
What is a value trap?
A stock that looks cheap on valuation ratios and stays cheap or gets cheaper, because the discount reflects real deterioration the ratios cannot see. The four most common causes are collapsing pricing power, an earnings history too erratic to trust, earnings at a cyclical peak, and structural decline in the underlying business.
Can an expensive-looking stock be undervalued?
Yes. A stock trading above screen thresholds can still sit below what its position and quality justify. Hoya at 33.53 times earnings never appears on cheapness screens, yet trades roughly 25% below its sector median with a 79% gross margin, the strongest in its coverage universe. Screens miss this box entirely.
How do you avoid value traps?
Interrogate every discount before acting on it. Check four things: real pricing power in the margins, an earnings history stable enough to trust, earnings that are not sitting at a cyclical peak, and a business that is not in structural decline. A discount that survives all four checks is a candidate. A discount that fails any of them is usually the market being right.
Written by the Stocks & Signals research team: 20+ years of experience across equity markets, algorithmic trading, and supply chain analysis.
The four-question interrogation is pre-run on every company we cover, scored 0 to 100 and ranked against peers. See the verdicts on live data in the free preview issue.