Map the Chain.
Beat the Crowd.

We map industry supply chains, find the monopolies that passive money ignores, and tell you which ones are undervalued.
Ranked picks, buy zones, key risks.

Launching soon. Be first to access our supply chain intelligence.

Semiconductor Value Chain
SAMPLE
EquipmentEUV LithographyMonopoly
FoundryAdvanced NodesMonopoly
DesignEDA SoftwareDuopoly
FablessAI / GPUOligopoly
#1 Pick Spotlight
82
Value Edge
Monopoly
Sole equipment supplier · 100% market share · No substitute
Buy zone● In buy zone nowTrim zone
Undervalued monopoly in the buy zone
EUV Lithography: Monopoly · UndervaluedAdvanced Foundry: Monopoly · UndervaluedAI Compute: Dominant · UndervaluedMobile IP: Licensed · OvervaluedChip Design: Challenger · OvervaluedAdvanced Packaging: Monopoly · UndervaluedEdge AI: Deep Value · High Yield
The Problem

By the time you read the news,
the trade is already over.

The stock moved before the headline hit your feed. And the alerts you did get? Half said buy, half said sell — all about the same mega-caps that passive money already owns. Meanwhile, the most irreplaceable companies in every industry are quietly trading at a discount.

The old way
Semiconductor stocks plunge on China export fears
8:02 AM
Why this chip stock could 5× by 2027
8:14 AM
SELL NOW: AI bubble showing signs of bursting
9:30 AM
Top analyst upgrades semiconductor sector to Buy
10:15 AM
Trade war escalation threatens global chip supply
11:45 AM
Insider buying signals confidence in chip recovery
12:30 PM
BREAKING: Chip giant misses earnings by 2%
1:00 PM
🏆 #1 Pick: Buy the market leader at all-time highs
1:45 PM
8 alerts. 4 say buy. 4 say sell. All about the same stocks.
The new way
Semiconductor Value Chain
🔗
Chain mapped — raw materials to end markets
🎯
Monopoly found — 100% share, no substitute
📊
Value Edge: 82 — undervalued vs. sector
📈
Buy zone hit — entry price reached
Rating: UndervaluedRank #1 Pick
82
Value Edge
VCQM framework
Export controls update
ASML, NVDA, SNPS exposed
1 report. Ranked picks. Clear action.

We replace noise with structure: map the supply chain, find the chokepoints, and rank what's underpriced right now.

The Insight Others Miss

The strongest monopolies are trading
cheaper than their own customers.

In every industry we cover, the same pattern appears: companies that control irreplaceable chokepoints — with no viable substitute — are often trading at lower multiples than companies with weaker moats and real competition. News-driven platforms will never surface this. We do.

What we find: undervalued bottlenecks
Sole equipment monopoly
100% market share, no substitute, trading below sector median
Advanced manufacturing lock-in
90%+ share of cutting-edge production, geopolitical discount
Critical materials monopoly
90%+ share of a niche input, trading at half the sector median
What we flag: overvalued hype
IP licensor with open-source threat
Extremely rich valuation pricing in perfection for years
Chip designer trailing the leader
Priced at 2× the sector median despite losing market share
Duopoly #2, pricier than its peer
Same business model as competitor, significantly higher multiple

A $5B fund can't buy a $500M monopoly without moving the price. You can.

Actively managed funds charge 1% to own the same 15 stocks as everyone else — because their managers get fired for being different. Meanwhile, every dollar flowing into the S&P 500 buys more of what's already large, not what's irreplaceable. The small-cap monopolists get ignored. We find them, and give you a thesis to hold against when the market gets noisy.

Live Preview

Intelligence, not just information

Explore actual data from our semiconductor industry module. Covering 500+ companies across energy, defense, healthcare, medical devices, and industrial supply chains.

Concentration & Margin Map — Semiconductors
Scores gated · darker = more investable
Raw Materials
Photoresist
Oligopoly · Strong
Conc
Margin
Neon Gas
Oligopoly · Commodity
Conc
Margin
Silicon Wafers
Oligopoly · Commodity
Conc
Margin
Equipment & IP
EUV Litho
Monopoly · Toll-booth
Conc
Margin
EDA Software
Oligopoly · Toll-booth
Conc
Margin
Etch & Dep.
Oligopoly · Strong
Conc
Margin
Fabrication
Adv. Foundry
Monopoly · Toll-booth
Conc
Margin
HBM Memory
Oligopoly · Strong
Conc
Margin
Mature Nodes
Competitive · Commodity
Conc
Margin
Packaging
Adv. Packaging
Concentrated · Strong
Conc
Margin
OSAT
Concentrated · Commodity
Conc
Margin
End Markets
Hyperscalers
Competitive · Strong
Conc
Margin
Mobile
Competitive · Commodity
Conc
Margin
Automotive
Competitive · Commodity
Conc
Margin
Concentration:
Monopoly
Oligopoly
Concentrated
Competitive
Margins (bar fill):
Commodity
Strong
Toll-booth
Investability score · subscribe to unlock
Disruption Scenario Engine
Pre-mapped supply chain exposure with winners and losers per scenario
Taiwan Strait Crisis

The vast majority of advanced chips are manufactured in Taiwan. Instantly see which stocks face supply disruption and which gain share.

🚫Export Controls Escalation

The supply chain fractures along geopolitical lines. See which holdings are exposed.

🔒 Winners & losers in full report
📉AI CapEx Pullback

Hyperscalers cut spending. See which companies are sheltered and which face margin compression.

🔒 Winners & losers in full report
Beneficiaries
INTCUS fab capacity gains share
GFSAlternative foundry demand surges
At Risk
NVDATSMC dependency, no alternative
AAPLiPhone production halts
Industries covered
SemiconductorsData CentersEV BatteriesElectric GridAerospaceBioprocessingSolar PVIndustrial AutomationDefense ElectronicsSpecialty ChemicalsMedical DevicesNuclear PowerWind TurbinesRare EarthsWater Technology& more

Reports updated quarterly per industry · New industries added regularly

What You Get

Every pick, ranked and rated

Ranked picks with a full thesis for each: a Value Edge score (0–100) combining valuation, consistency, quality, and momentum, so you can see at a glance which are undervalued and high-quality.

Top Picks — Semiconductors
Updated regularly
#CompanyWhyValue EdgeRating
1
Irreplaceable monopoly, sole provider of critical equipment82Undervalued
2
Manufacturing lock-in, massive valuation discount78Undervalued
3
Market dominance, earnings growth compressing multiple74Undervalued
4
Deepest value in sector, highest dividend yield71Undervalued
5
Vertical integration leader, defensive cash-rich moat52Fair Value

Each pick includes full investment thesis, key risks, and buy/trim zone analysis. Updated regularly per industry.

🔍
Be the first to see it
We'll send you a free supply chain preview as soon as it's ready. Plus early access to the full platform at launch.
How It Works

From supply chain map to stock pick

Map the structure. Find the undervalued bottlenecks. Monitor the risks.

Map the Supply Chain

NVIDIA can't ship a single GPU without TSMC, ASML, and three Japanese chemical companies you've never heard of. We map those dependencies — every supplier, every chokepoint, every hidden single point of failure.

Find the Bottlenecks

Identify the toll bridges of every industry. Which companies have no viable alternative? Which control a single node that the entire supply chain depends on? A $3B niche supplier with 100% share can be more investable than a $500B conglomerate with substitutable products.

82

Score Every Company

Is it cheap vs peers? Stable demand and margins? Is the business actually good? Is it getting better? Our VCQM framework is built on EV/EBITDA, P/FCF, ROE, and a dozen more fundamentals across up to 5 years of quarterly data.

Plot the Sweet Spot

Cheap stocks are everywhere. Cheap monopolies are rare. We plot every company on two dimensions — how irreplaceable and how undervalued. The sweet spot is where they overlap. Most screeners only find cheap. We find cheap and irreplaceable.

Select the Picks

Ranked picks per industry — not the cheapest stocks, but the best combination of valuation and bottleneck power. Each with a full thesis, key risk, and target rationale. Plus a shortlist of near-misses with specific upgrade triggers — so you know exactly what would promote them.

Monitor Disruptions

What-if disruption scenarios with specific winners and losers for every industry. 13 global shipping chokepoints pre-mapped with affected stocks and severity ratings. When a disruption hits, you already know who wins, who loses, and what to do.

Supply chain intelligence

Before trade routes break,
you'll know which stocks move

Every chokepoint pre-mapped with affected industries, exposed stocks, and impact analysis — before a disruption happens. When one does, you already know who wins, who loses, and what reverses when it ends.

Critical
Significant
Moderate
Panama CanalWatchEl Niño 2026

El Niño expected mid-2026. Previous drought slashed daily transits. Pre-mapped exposure if restrictions return.

ADMBGLNG
13
Chokepoints tracked
100+
Stocks affected
2
Active alerts
vs. alternatives

They react to news.
We map the system behind it.

PlatformPriceFundamentalsValue Chain MappingUndervaluation RatingScenariosDisruptions
Institutional
FactSet$3,750/mo
Bloomberg$2,000/mo
Retail Research
Morningstar$35/mo
Seeking Alpha$20/mo
Motley Fool$17/mo
Value Chain Intelligence
Stocks & SignalsNEW$33–249/mo

FactSet & Bloomberg priced for single-seat enterprise license. Morningstar offers star ratings based on single-factor DCF — not multi-factor composite scoring. Seeking Alpha's Quant Rating is momentum-weighted, not undervaluation-focused.

Institutional-grade methodology at a retail price
Built on original source data: regulatory filings, industry databases, and financial data providers — with a proprietary methodology that scores competitive positions across every segment of the supply chain. Independent analytics from Switzerland, updated regularly.
Multi-factor scoringRegular updatesOriginal source dataGlobal coverage
Pricing

Institutional intelligence, retail pricing

Bloomberg charges $24K/yr for supply chain data. Third Bridge charges $10K–$50K. We start at $33/mo.

Save up to $1,389/yr
Insider
$33/mo
Billed $396/year Save $72/yr
For research-first investors
Institutional-grade supply chain research at a fraction of the cost.
Ranked stock picks with full investment thesis, global coverage
Buy & trim zones for every top pick
Value Edge composite score and rating
Full supply chain map with concentration & margin analysis
Disruption scenarios with winners and losers
All covered industries
Weekly new & updated reports
Quarterly industry refresh cycle
New report email alerts
30-day refund · cancel anytime
Most Popular
Strategist
$79/mo
Billed $948/year Save $360/yr
vs. $24K/yr for a Bloomberg terminal
For active investors
Your live dashboard. Prices update daily, scores refresh after earnings, disruptions trigger alerts.
Includes everything in Insider, plus:
Live dashboard with daily closing prices
Score updates within days of each earnings release
Full VCQM breakdown — Valuation, Consistency, Quality, Momentum per pick
Rank companies to match your strategy — momentum trader, value buyer, quality compounder
Buy/trim zone alerts — notified when price enters a zone
Cross-industry Value Edge leaderboard
Live chokepoint map — 13 global shipping & trade routes
Disruption tracker with winners, losers & resolution
30-day refund · cancel anytime
Pro
$189/mo
Billed $2,268/year Save $720/yr
For deep-dive investors
Full VCQM deep dives on any stock. Model custom disruptions. See risks nobody else surfaces.
Includes everything in Strategist, plus:
5 deep dives per month, on request — full thesis, VCQM breakdown, buy/trim zones
Model custom disruption scenarios across supply chains
See where your stocks share hidden supplier dependencies
Custom Value Edge score and price alerts
Export reports as PDF
Early access to new industry reports
Request & upvote new industries
Priority support
30-day refund · cancel anytime
Enterprise
For funds, consultancies, and research teams.
Everything in Pro
Unlimited deep dives
Industry requests on-demand
Multi-seat access
API access to scores & data
Historical scores
White-label reports
Dedicated account manager
🛡️
30-day money-back guarantee. If the reports aren't worth it, we'll refund you — no questions asked.
FAQ

Common questions

Is this financial advice?
No. Stocks & Signals is an independent data platform. We provide research tools and analytics, not personalized investment advice. Our ratings are impersonal and not portfolio-specific. Always do your own due diligence, you are responsible for your own investment decisions.
Most active funds underperform the index. Why would I even try?
The data is clear: most active funds underperform over 20 years. But they underperform because of fees, career risk, and benchmark-hugging — not because finding undervalued companies is impossible. You have none of those constraints. A $5B fund can't take a meaningful position in a $500M monopoly without moving the price. You can. We're not suggesting you replace your index funds. Keep them as your core. But when most of the market's capital is passive, a small-size monopoly with no substitute still gets priced like any other mid-cap. We map the supply chain to find where the market is wrong: which nodes are irreplaceable, which controllers are undervalued, and where hidden dependencies connect across the supply chain. When markets drop, most investors sell because they have no framework for deciding whether to hold. A structural thesis gives you a concrete checklist: monopoly position, substitution risk, valuation gap. If nothing structural changed, you hold. Instead of blind conviction, you work with informed discipline.
How is this different from using ChatGPT to research stocks?
ChatGPT doesn't maintain a structured database of supply chains, concentration scores, or valuation models. We do. Built on original source data from regulatory filings, industry databases, and institutional-grade financial providers, with a proprietary methodology that maps competitive positions across every segment of the supply chain. LLMs hallucinate financial data. We source it.
How current is the data?
Strategist and Pro dashboards show live closing prices updated daily. Scores refresh automatically within days of each company's earnings release. New and updated reports publish weekly across our coverage. Each industry refreshes on a quarterly cycle.
Who's behind Stocks & Signals?
An independent research team based in Switzerland with backgrounds in engineering, supply chain management, and quantitative investing. We built this because the tools we wanted didn't exist — institutional-grade supply chain analysis without the institutional price tag.
Can I try before I subscribe?
Sign up with your email and we'll send you a free preview of our semiconductor report as soon as it's ready — executive summary and full value chain map. Early subscribers get first access at launch.

Stop chasing headlines.
Start buying the bottlenecks.
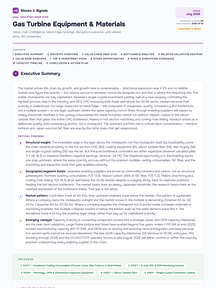
We're launching soon. Drop your email to get first access and a free semiconductor supply chain preview when it's ready.

No credit card required. Unsubscribe anytime.

See pricing plans →